Report Card: Nova Entertainment
Nova Entertainment has, since its launch by Paul Thompson and DMGT 15 years ago, through to its current ownership by Lachlan Murdoch's Illyria, always been a privately held company.
This has meant that unlike the other major metropolitan networks (ARN, SCA and Fairfax) whose results are available bi-annually due to their publicly listed owners, the Nova Entertainment business is comparatively discreet.
Today, in a report published by Bob Peters Global Media Analysis, we are privy to the performance of Nova Entertainment, and reveal for the first time publicly significant detail about the business.
You can see the report in full below.
 Nova's Numbers Examined
Bob Peters (right): Global Media Analysis
Summary
Nova Entertainment (Nova) significantly outperformed the overall commercial metropolitan radio sector in terms of ratings, revenue and profit growth in calendar year 2013 (CY 2013).
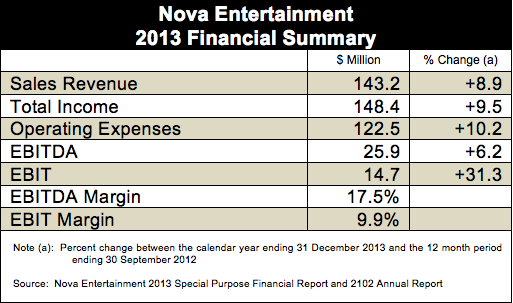
Nova reported sales revenues of $143.2 million, earnings before interest tax depreciation and amortisation (EBITDA) of $25.9 million and earnings before interest and tax (EBIT) of $14.7 million during the twelve month period ending 31 December 2013.
As Nova changed it financial balance date from end September to end December during CY 2013, it is not possible to measure the precise growth in the group’s key financial indicators during the most recent twelve month period.
However, a comparison of results in CY 2013 to those in the twelve months ending 30 September 2012 (FY 2012) reveals an above industry average performance by Nova with: an 8.9% increase in sales revenues, a 6.2% increase in EBITDA and a 31.3% increase in EBIT between the two twelve month periods.
Nova also increased its average 10+ audience metro audience[1] by an impressive 10.3% during calendar 2013, giving it an average audience that was 3.3% larger than that of the Australian Radio Network (ARN) over the same period.
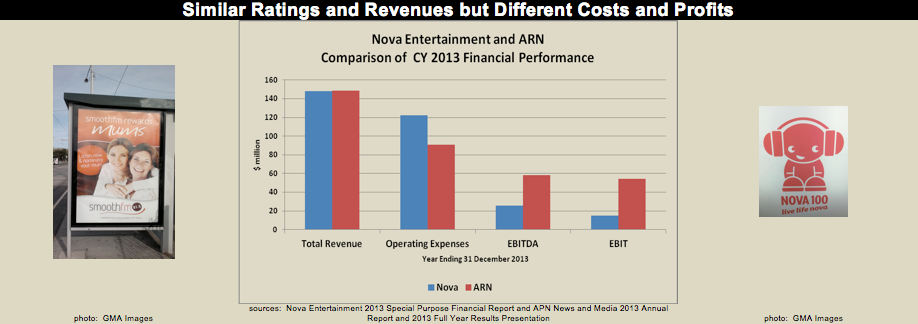
In calendar 2013, Nova reported total revenues which were almost identical those of ARN. However, Nova’s operating expenses were significantly higher and its profits and margins substantially lower than those generated by ARN during the same period.
[1] Average audience, people 10+, Monday to Sunday, 5:30am to 12 midnight, surveys 1 to 8 of 2013, as measured by Nielsen Media on behalf of Commercial Radio Australia, the copyright holder.
Nova Compared to ARN
During CY 2013, Nova captured an average 10+ metro audience which was 3.3% larger than ARN’s.
Nova’s total revenue of $148.4 million in CY 2013 was virtually identical to the $148.9 million reported by ARN over the same period. However there were significant differences in the operating costs, profits and margins of the two large metro radio groups last calendar year.
The $122.5 million in operating costs (before depreciation, amortisation, interest and tax) reported by Nova in CY 2013 were 34.8% higher than the $90.9 million in opex reported by ARN.
With a similar revenue base, but a substantially higher cost structure, Nova’s reported EBITDA of $25.9 million last year was less than half of the $58.9 million generated by ARN for the same period.
Consequently, while ARN enjoyed industry-leading EBITDA margins of 39.0% last calendar year, Nova’s were a much lesser 17.5%.
note: click below graph to enlarge.
Historical Performance Highlights
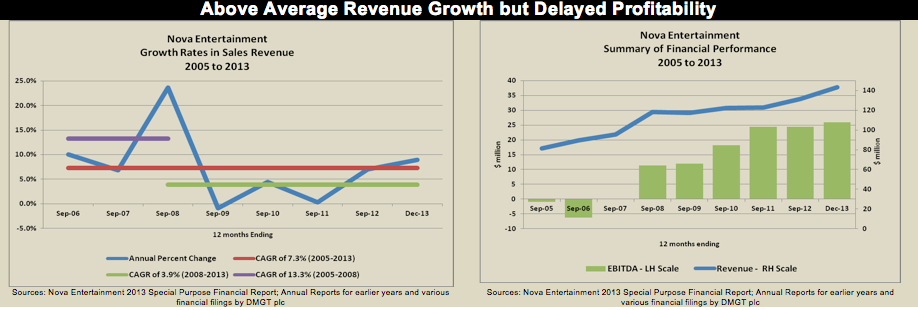
An analysis of Nova’s financial performance over the nine years between FY 2005 and CY 2013 reveals two major trends, namely: that the group enjoyed above-average growth in sales revenues over that period but that it was not until FY 2008 that the group began to generate any appreciable profits.
Nova’s above-average revenue growth between FY 2005 and CY 2013 was largely the result of it both bringing new stations to air at the start of that period and then subsequently developing and refining very successful program formats and on-air talent for them, particularly, in more recent years, at the two stations which are now branded as smooth fm in Sydney and Melbourne.
Over the entire period between FY 2005 and CY 2013, sales revenue increased at a healthy 7.3% compound annual growth rate (CAGR), with especially strong growth of 13.3% per annum occurring between FY 2005 and FY 2008, prior to the onset of the global financial crisis (GFC).
Even though Nova’s sales revenue increased at a lesser 3.9% CAGR in the post-GFC period between FY 2008 and CY 2013, that performance was still appreciably better than that of the overall commercial metro radio sector.
But, in contrast to its above-average revenue growth since FY 2005, it was not until FY 2008, that Nova began to realise any noticeable level of profitability from its metro operations. Until that time, the apparent priority of its previous and founding owner, DMGT plc of the United Kingdom, was to expand station numbers and build audiences on the back of extremely impressive early ratings successes.
note: click below graph to enlarge.
Although that strategy had produced good revenue growth up to FY 2008, such growth also had, up until then, been accompanied by comparable increases in operating costs, which had effect of making any serious profitability an elusive prize.
However, since FY 2008 there have been continuing improvements in profitability, particularly in FY 2010 and FY 2011, which illustrates both the superb timing and positive influence of Lachlan Murdoch’s Illyria Investments, which acquired an initial 50% shareholding in Nova in November 2009.
The Operating Costs Conundrum
Critical to future profit growth and margin improvement at Nova will be the challenging task of continuing to generate above average growth in ratings and revenue, while at the same time keeping a check on expense increases.
However, an examination of the composition of Nova’s operating cost structure highlights one of the more unique characteristics of commercial metro radio, which is that staff costs and advertising expenses account for a very substantial portion of total operating expenses.
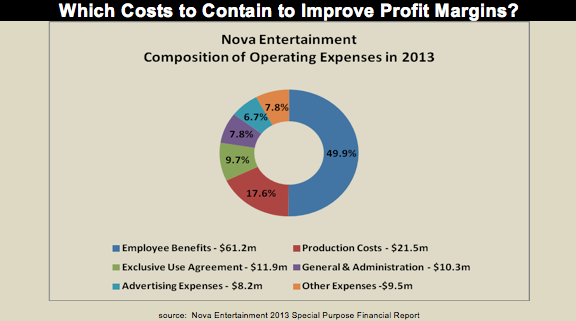
Just under half of Nova’s operating expenses in CY 2013 were in the form of employee benefits which totalled $61.2 million and trying to keep an on-going lid on such costs in a metro radio organisation can be a very tricky affair.
Having top talent in all departments is usually a prerequisite for maintaining a financially successful commercial metropolitan radio operation. However, top talent is difficult to find, costly to train and develop and then often even more expensive to retain.
Thus, unlike the situation in some other businesses, the continued cutting of staff numbers and remuneration very often is not a viable strategy for long term financial success in commercial radio, particularly amongst top rating stations operating in competitive metropolitan markets.
Moreover, top on-air talent also needs to be continually promoted and supported and it is therefore not surprising that 6.7% of Nova’s total operating expenses in CY 2013 were devoted to advertising.
In some industries advertising and promotional expenses are sometimes considered to be at least partly discretionary costs because they can be increased or decreased fairly quickly.
However, it could be a very ill-considered move on the part of the owners and/or management of a top-rating commercial radio station operating in a competitive metro market to regard such expenditures as being non-essential and something that can, and perhaps should, be regularly reduced in order to offset any sudden downturns in revenue, in order to maintain short-term profitability.
Exclusive Use Agreement Costs
Finally, a curious component of Nova’s operating cost structure in CY 2013 was an item described as being an exclusive use agreement (EUA) expense. That cost amounted to a not insubstantial $11.9 million and was the group’s third largest itemised expense, accounting for 9.7% of total operating expenses.
If that EUA expense was in fact some form of payment to Nova’s parent company for management or advisory services provided, then it could perhaps be argued that either some, or all, of that amount could actually be regarded as being additional operating profit.
The addition of an extra $11.9 million to Nova’s reported EBITDA and EBIT last year, would have lifted reported EBITDA and EBIT margins to 25.5% and 17.9% respectively.


